


Ranked #6 in National Institutes of Health funding

Ranked #1 in New York State and #5 in the Nation
News
- August 17, 2023
Columbia is named a Maternal Health Research Center of Excellence with funding from the NIH for NY-CHAMP>
Topic
- February 16, 2024
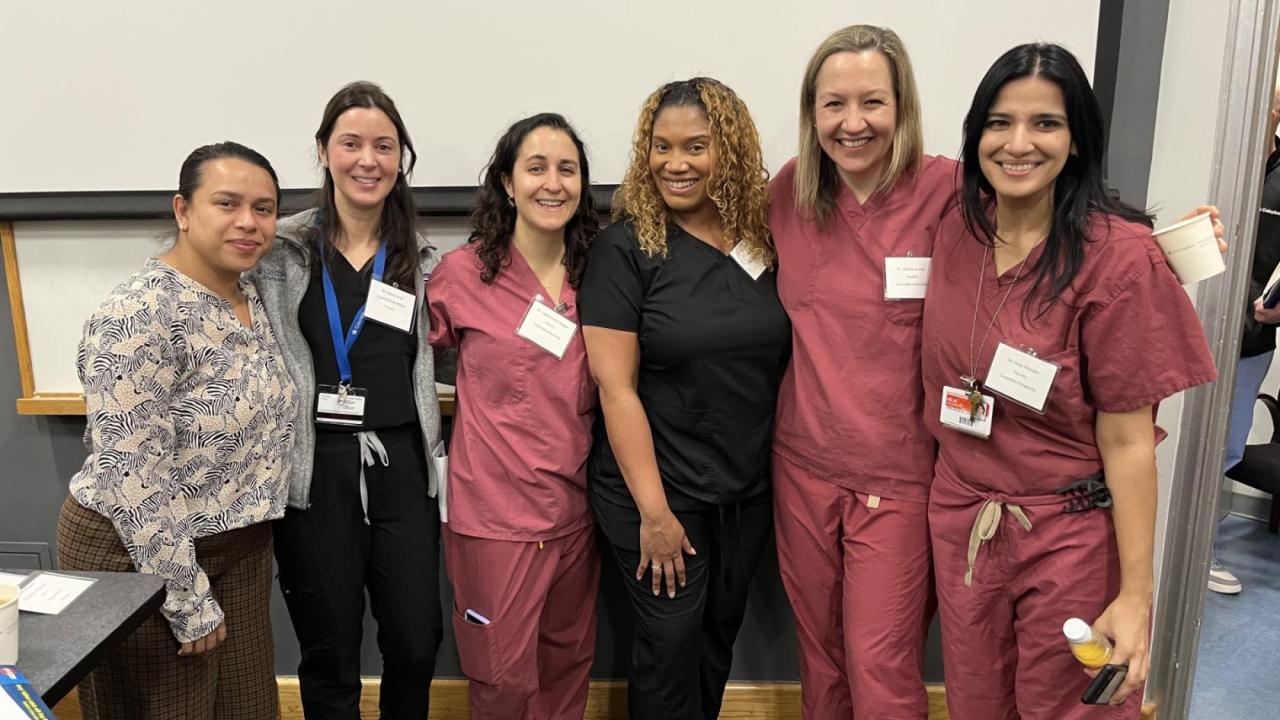
The Department of Obstetrics and Gynecology at NewYork-Presbyterian/Columbia University Irving Medical Center (CUIMC) hosted the New York City Regional Urogynecology Fellows Course on February 9.
Topic
- May 4, 2022
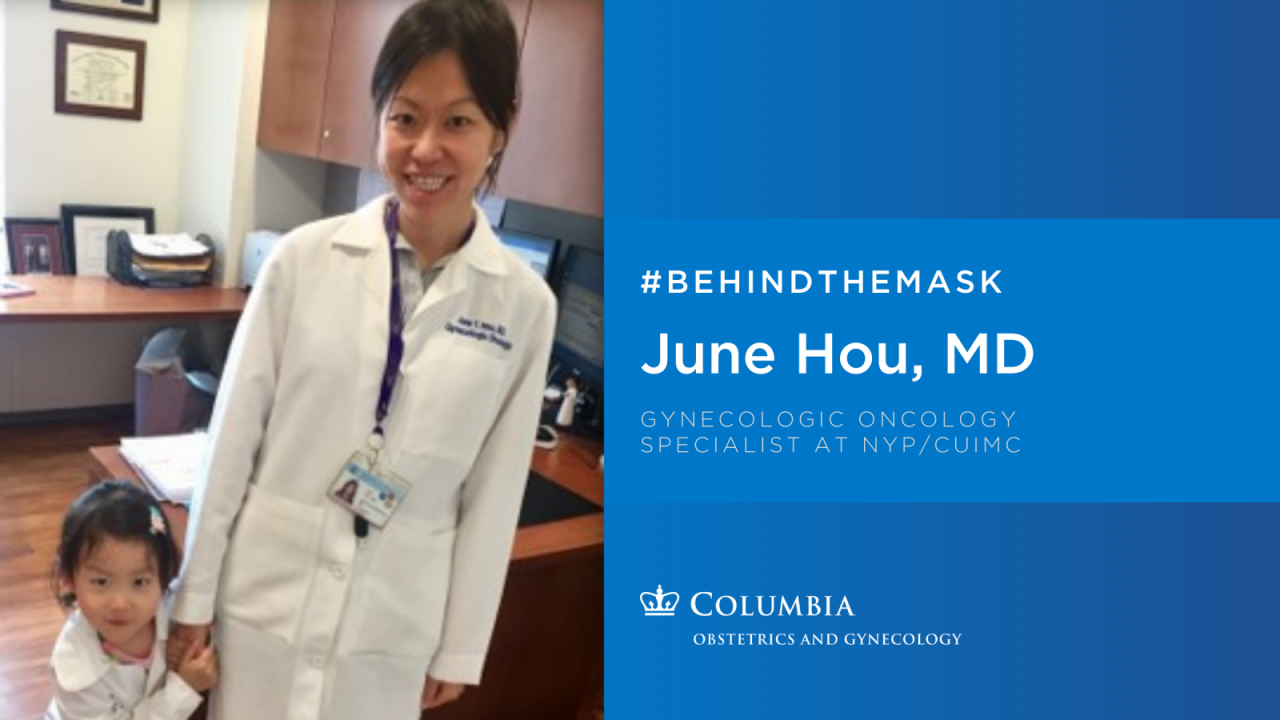
#BehindtheMask is a series that spotlights the faculty, staff, and trainees in our department. Today, meet June Hou, MD.
- March 25, 2022
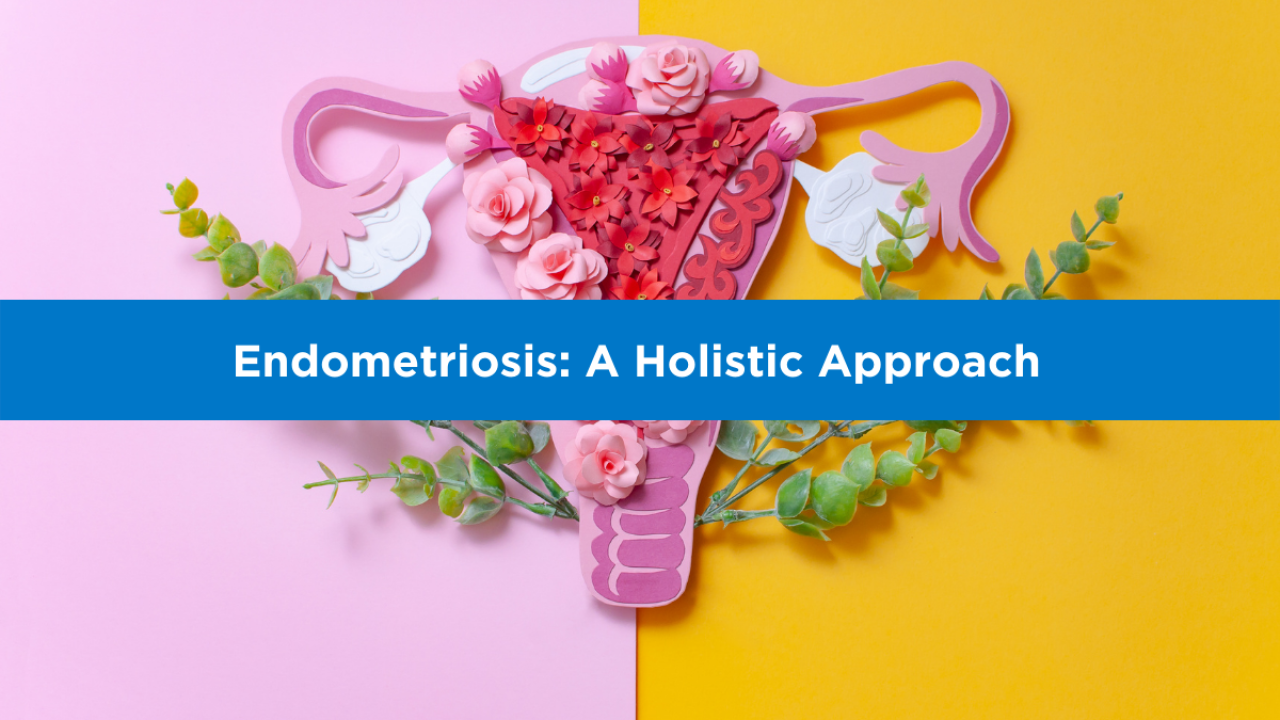
Learn more about treatment for endometriosis, such as fertility-sparing surgeries and optimization of medical therapies.
Meet our Department

Events
- Thursday, May 2, 202412:30 PM to 5:00 PM
Venue
Online Event